BAKU, Azerbaijan, Feb. 28
By Elnur Baghishov – Trend:
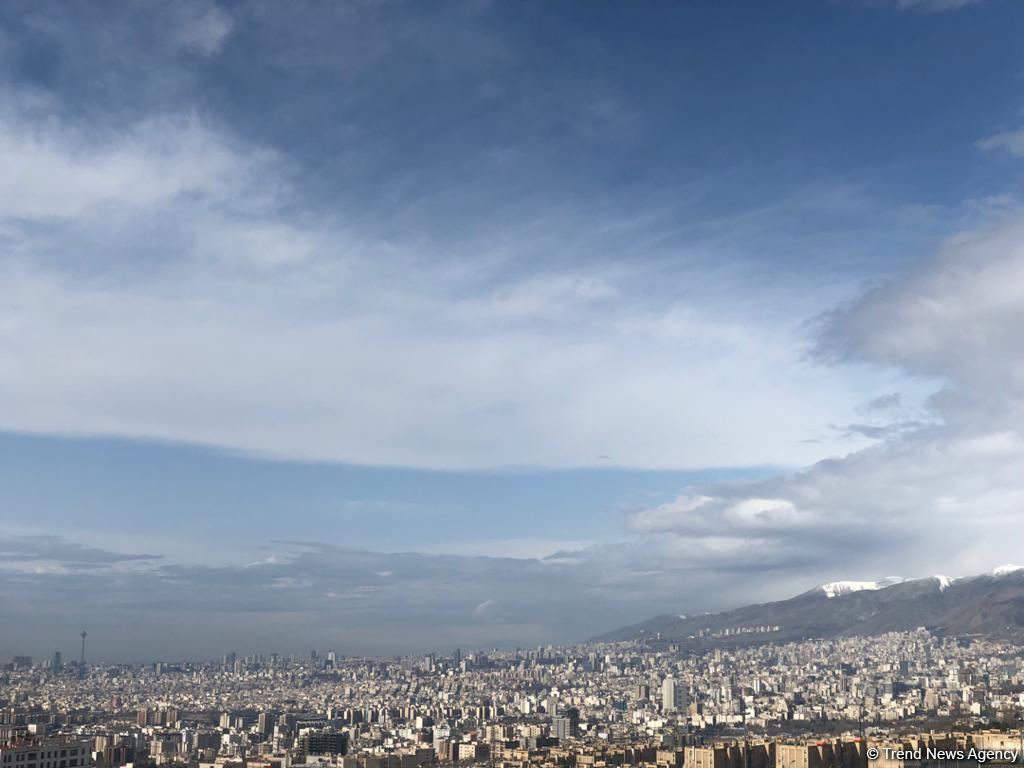
The average price of 1 square meter of an apartment in Tehran city was 331 million rials (about $7,870) in the 11th month of the current Iranian year (January 21 through February 19, 2022), Trend reports via the statistics of the Central Bank of Iran (CBI).
According to the statistics, the price of apartments per square meter increased by 0.4 percent compared to the 10th month of the current Iranian year (December 22, 2021 through January 20, 2022). So, the average price of 1 square meter of an apartment in Tehran city was 329 million rials (about $7,842) in the 10th month.
In addition, the average price of 1 square meter of an apartment in the 11th month increased by 16.4 percent, compared to the same month last Iranian year.
“The most expensive price for apartments between 22 districts of Tehran was registered in the 1st district over the 11th month. Thus, the price of apartments per square meter in the district amounted to 703 million rials (about $16,729). Meanwhile, the cheapest apartment prices in the 11th month were registered in the 18th district," said the report.
"So, the price of apartments per square meter in this district was 157 million rials (about $3,730). The prices in these districts increased by 17.3 percent and 30.7 percent, respectively, compared to the same month of the last Iranian year,” the statistics said.
|
Period |
Percentage change |
||||
|
11th month of the current Iranian year (Jan. 21 through Feb. 19, 2022) |
10th month of the current Iranian year (Dec. 22, 2021 through Jan. 20, 2022) |
11th month of the last Iranian year (Jan. 20, through Feb. 18, 2021) |
Compared to the last month |
Compared to the same month in last Iranian year |
|
|
Buy/sell of apartments |
8,532 |
9,816 |
3,917 |
-13.1 |
117.8 |
|
The average price of apartments per square meter ($) |
7,870 |
7,842 |
6,759 |
0.4 |
16.4 |
The following table shows the number of apartments sold in Tehran city for the same month in different years:
|
Age of building |
The 11th month |
Percentage change |
Share interest |
||||
|
11th month of the current Iranian year (Jan. 21 through Feb. 19, 2022) |
11th month of the last Iranian year (Jan. 20, through Feb. 18, 2021) |
11th month of the preceding Iranian year (Jan. 21 through Feb. 19, 2020) |
11th month of the current Iranian year (Jan. 21 through Feb. 19, 2022) |
11th month of the last Iranian year (Jan. 20, through Feb. 18, 2021) |
11th month of the current Iranian year (Jan. 21 through Feb. 19, 2022) |
11th month of the last Iranian year (Jan. 20, through Feb. 18, 2021) |
|
|
Under 5 years |
2,871 |
1,545 |
5,731 |
85.8 |
-73.0 |
33.6 |
39.4 |
|
6-10 years |
1,753 |
685 |
2,410 |
155.9 |
-71.6 |
20.6 |
17.5 |
|
11-15 years |
1,180 |
563 |
1,677 |
109.6 |
-66.4 |
13.8 |
14.4 |
|
16-20 years |
1,545 |
629 |
2,168 |
145.6 |
-71.0 |
18.1 |
16.1 |
|
Over 20 years |
1,183 |
495 |
1,278 |
139.0 |
-61.3 |
13.9 |
12.6 |
|
Total |
8,532 |
3,917 |
13,264 |
117.8 |
-70.5 |
100 |
100 |
---
Follow the author on Twitter:@BaghishovElnu


